Firebase Performance Quickstart
Firebase announced Performance Monitoring for the Web at Google I/O 2019 - a long-awaited feature for Progressive Web Apps. It provides a simple way to add robust performance analytics to your app with minimal effort, while also adding the ability to run custom traces in your code. In the following lesson, you will learn how to add this new tool to any web app and setup traces to find performance bottlenecks.
Initial Setup
The following demo uses Angular, but the principles apply to any frontend JavaScript web app - checkout the official guide for setup instructions in non-Angular projects. By simplying including the performance package in your app you will receive metrics related to page load and HTTP performance.
Keep in mind, you can use Firebase Performance as a standalone service without any other Firebase dependencies. In this case, you would want to load the lightweight script via the CDN as described in docs.
At the time of this article, performance in AngularFire is available under the next tag.
npm i firebase
npm i @angular/fire@next
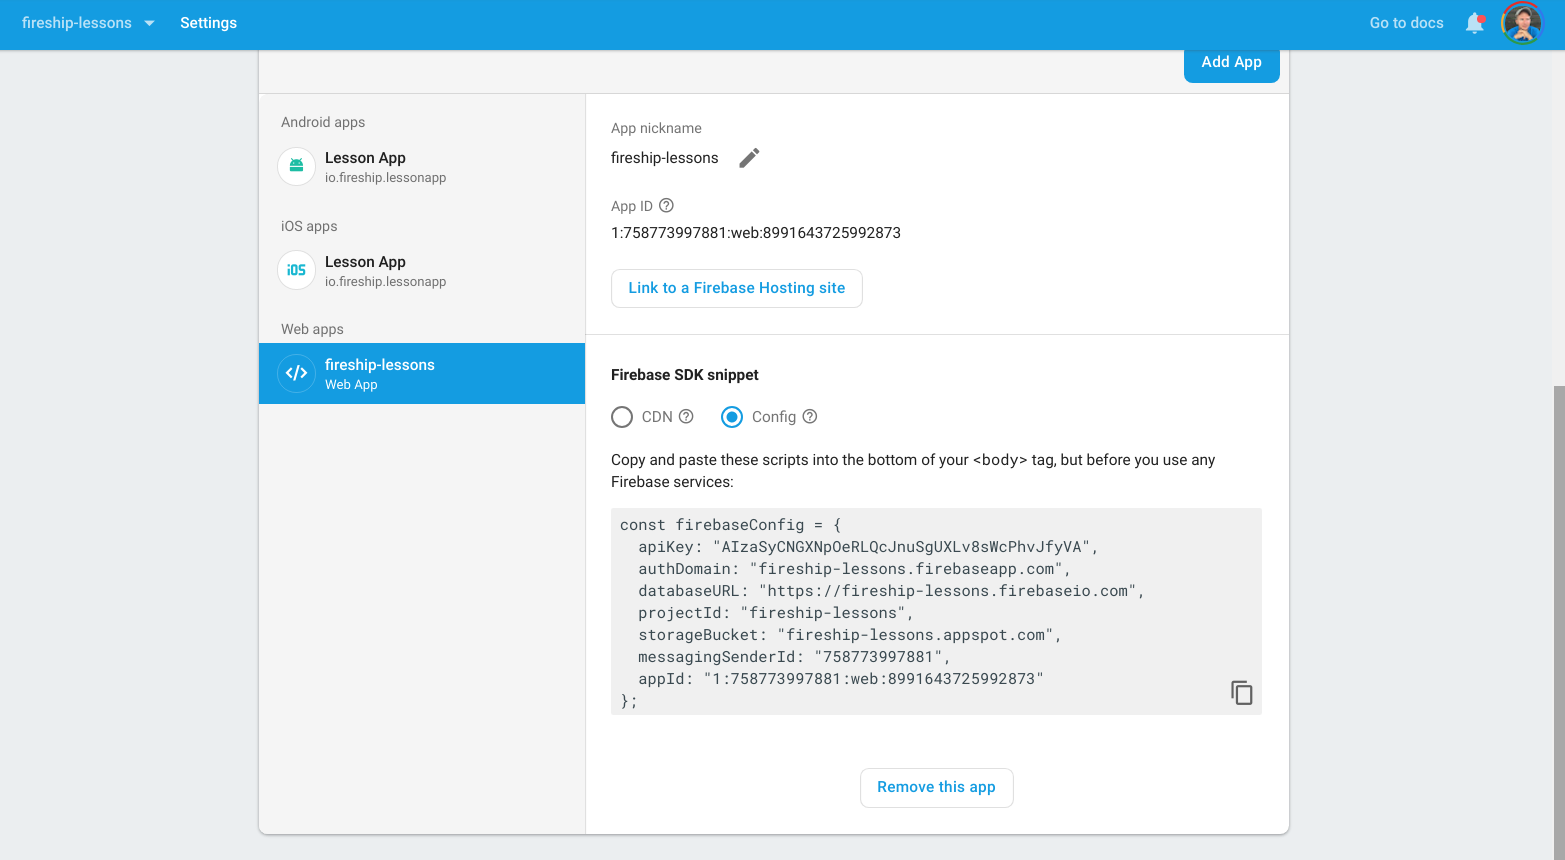
Grab your Firebase config from the console, then initialize AngularFire & Firebase in Angular.

Make sure you have the new Firebase config object with an appId property
const firebaseConfig = {
    // ...firebase config
  appId: '1:xxxxxxxxxxxxxxxx'  // <-- make sure you have this field
};

import { AngularFireModule } from '@angular/fire';
import { AngularFirePerformanceModule } from '@angular/fire/performance';


@NgModule({
  declarations: [
    AppComponent,
  ],
  imports: [
    BrowserModule,
    AngularFireModule.initializeApp(firebaseConfig),
    AngularFirePerformanceModule
  ],
  providers: [],
  bootstrap: [AppComponent]
})
export class AppModule { }
Track Page Load Metrics
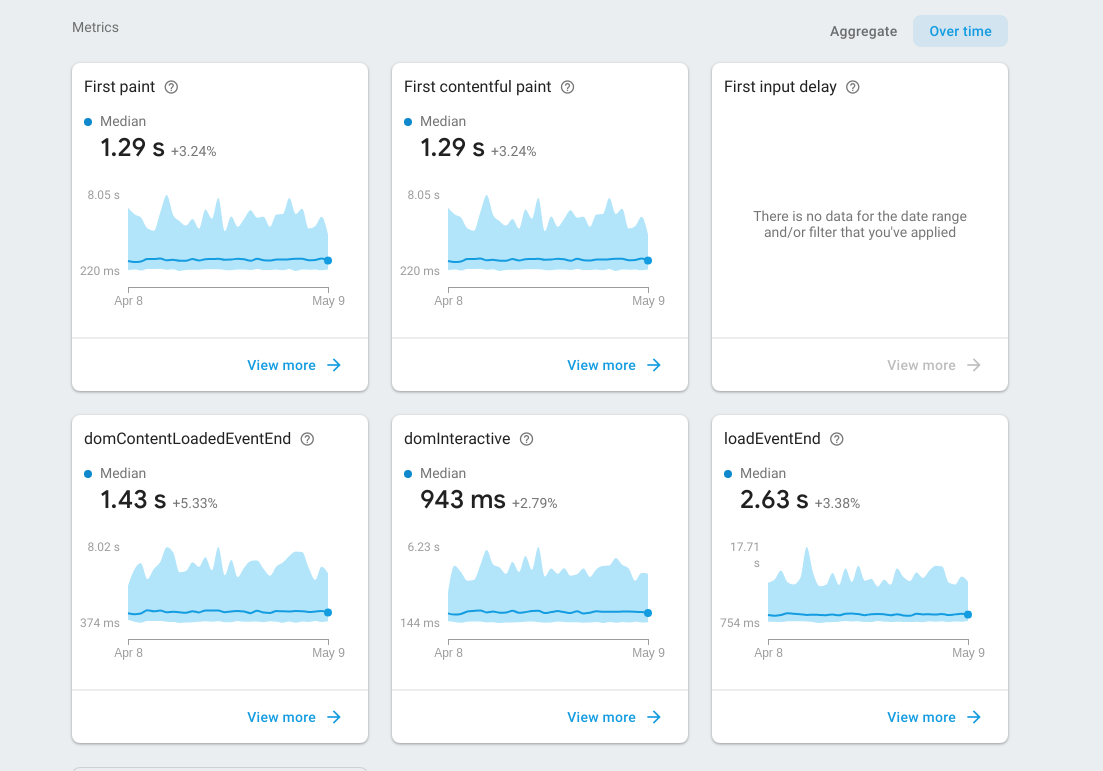
Just sit back and relax. Firebase will automatically collect the same page load stats you can find locally in a Chrome Lighthouse audit, but will be segmented by region, device, browser, and can even tell you if a service worker is installed. In addition, you can view the latency and payload size of any HTTP request that flows through your app.

Firebase Performance will automatically track page loads stats
User Login
A common use-case for a custom trace is your user authentication flow. Failing to get a user logged in or signed up quickly is a good recipe to bounce them forever.
What is the difference between an Attribute and a Metric?
An attribute is a string value segments data on the Firebase console. A metric is a numeric value that can be charted and might change over the lifecycle of the trace - in other words, a metric is a value that you want to measure over time.
Trace Login Time
For example, How long does it take the average user to get logged in?. But we don’t have to stop there - we can also add custom attributes to segmenent reports based on custom data attributes and trace specific errors that happen during the login process.
import { Component } from '@angular/core';
import { AngularFireAuth } from '@angular/fire/auth';

import * as firebase from 'firebase/app';
const perf = firebase.performance();

@Component(...)
export class LoginComponent {

  constructor(private afAuth: AngularFireAuth) {}

  async login(email, pass) {
    const trace = perf.trace('userLogin');
    trace.start();

    try {
      const credential = await this.afAuth.signInWithEmailAndPassword(email, pass);

      trace.putAttribute('verified', `${credential.user.emailVerified}`);
      trace.stop();

    } catch (err) {
      trace.putAttribute('errorCode', err.code);
      trace.stop();
    }

  }

}

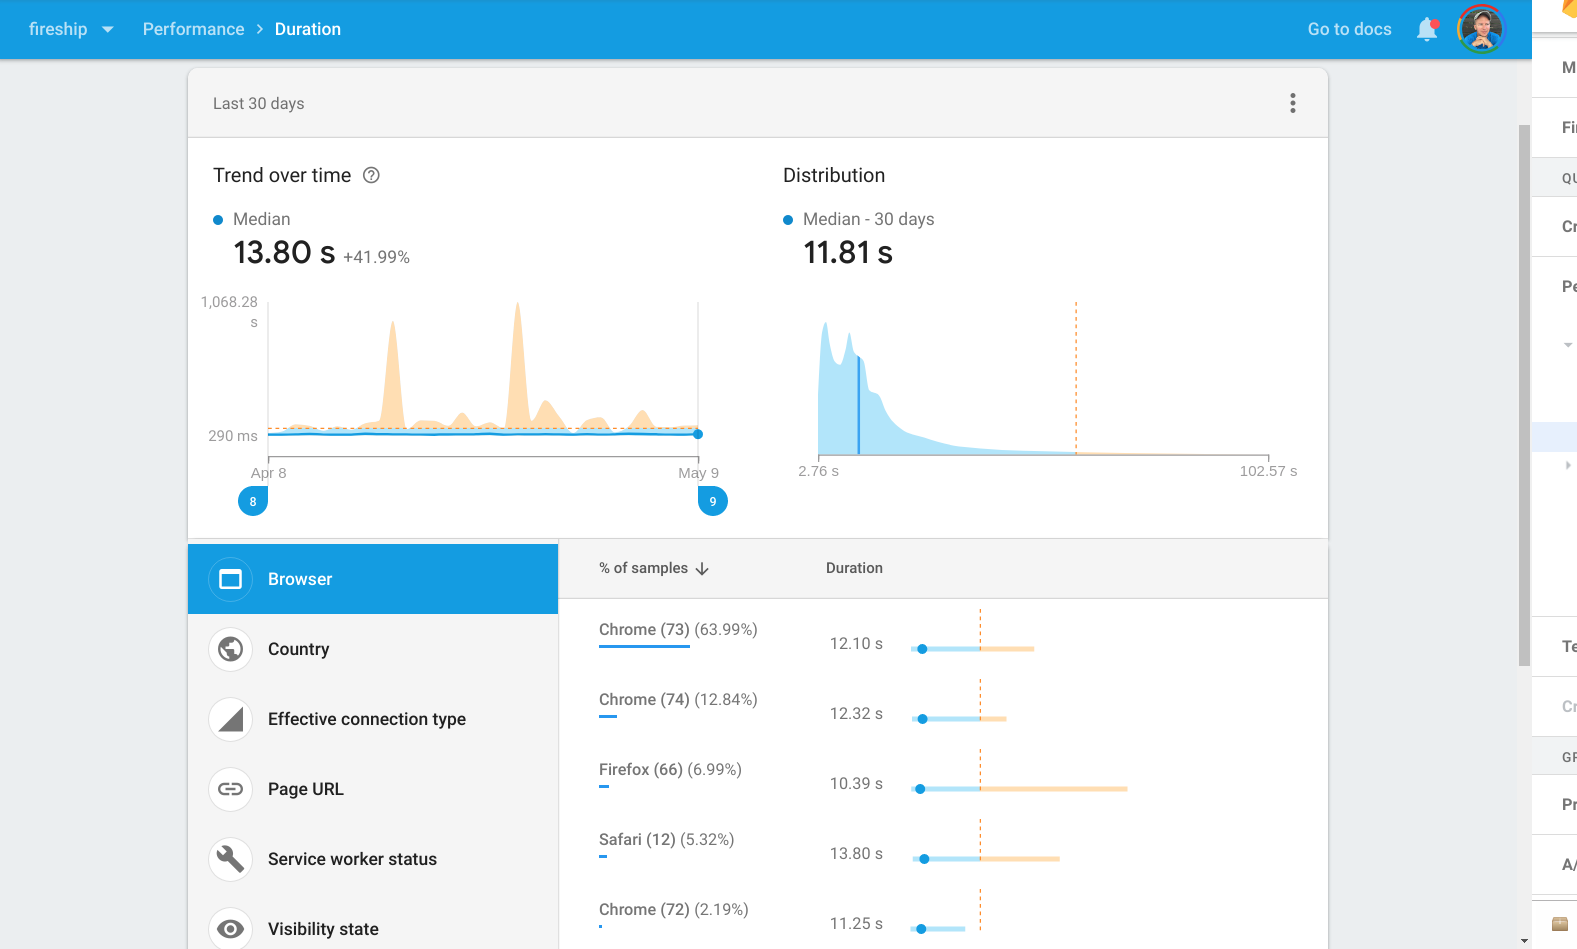
Metrics related to the user login process
Trace Lifecycle Hooks
On iOS and Android, Firebase runs a screen trace to measure the lifetime of a screen detect frozen screens. You can use lifecycle hooks in your preferred framework to get similar results on the web. Here’s how we can archive this in Angular:
export class LoginComponent implements OnInit, OnDestroy {

  screenTrace: firebase.performance.Trace;


  ngOnInit() {
    this.screenTrace = perf.trace('loginScreen');
    this.screenTrace.start();
  }

  ngOnDestroy() {
    this.screenTrace.stop();
  }
Firestore
Firebase Perf can also be very useful when it comes understanding database performance.
Trace Read Latency and Quantity
How many documents did I read in a collection and how long did it take? Normally, you should have a limit set on your queries to avoid excessive reads in large collections, but this is not always possible. The incrementMetric method is especially useful if you want to keep a running count of a value during the trace.
  async loadUserData() {
    const trace = perf.trace('itemsQuery');

    const items = await this.db.collection('items').get();
    trace.incrementMetric('collectionSize', items.size);

    const things = await this.db.collection('things').get();
    trace.incrementMetric('collectionSize', things.size);

    trace.stop();
  }
AngularFire Performance with RxJS
In this section, we will take an early look at some of the custom RxJS pipes proposed for the @angular/fire package. By simply adding the trace pipe we can start/stop a trace after an Observable emits data.
export class ItemsComponent implements OnInit {

  constructor(private perf: AngularFirePerformance, private db: AngularFirestore) { }

  items;


  ngOnInit() {

    this.items = this.db.collection('items').snapshotChanges()
      .pipe(

        // Custom RxJS Operator
        this.perf.trace('itemsQuery')

      );

  }

}
Other Ideas for Performance Monitoring
Firebase Performance can be used for almost any feature you suspect might be a bottleneck that hurts the user experience. Here is a short list of additional areas you may want to consider for performance monitoring.
- Complex API Calls (Beyond the automatic traces on HTTP calls)
- Firebase Storage Uploads & Downloads
- Component Routing and Rendering
- Use
trace.record()to monitor activity on specific time intervals.
